Dashboard & BI Tools (Looker, Power BI)
Overview
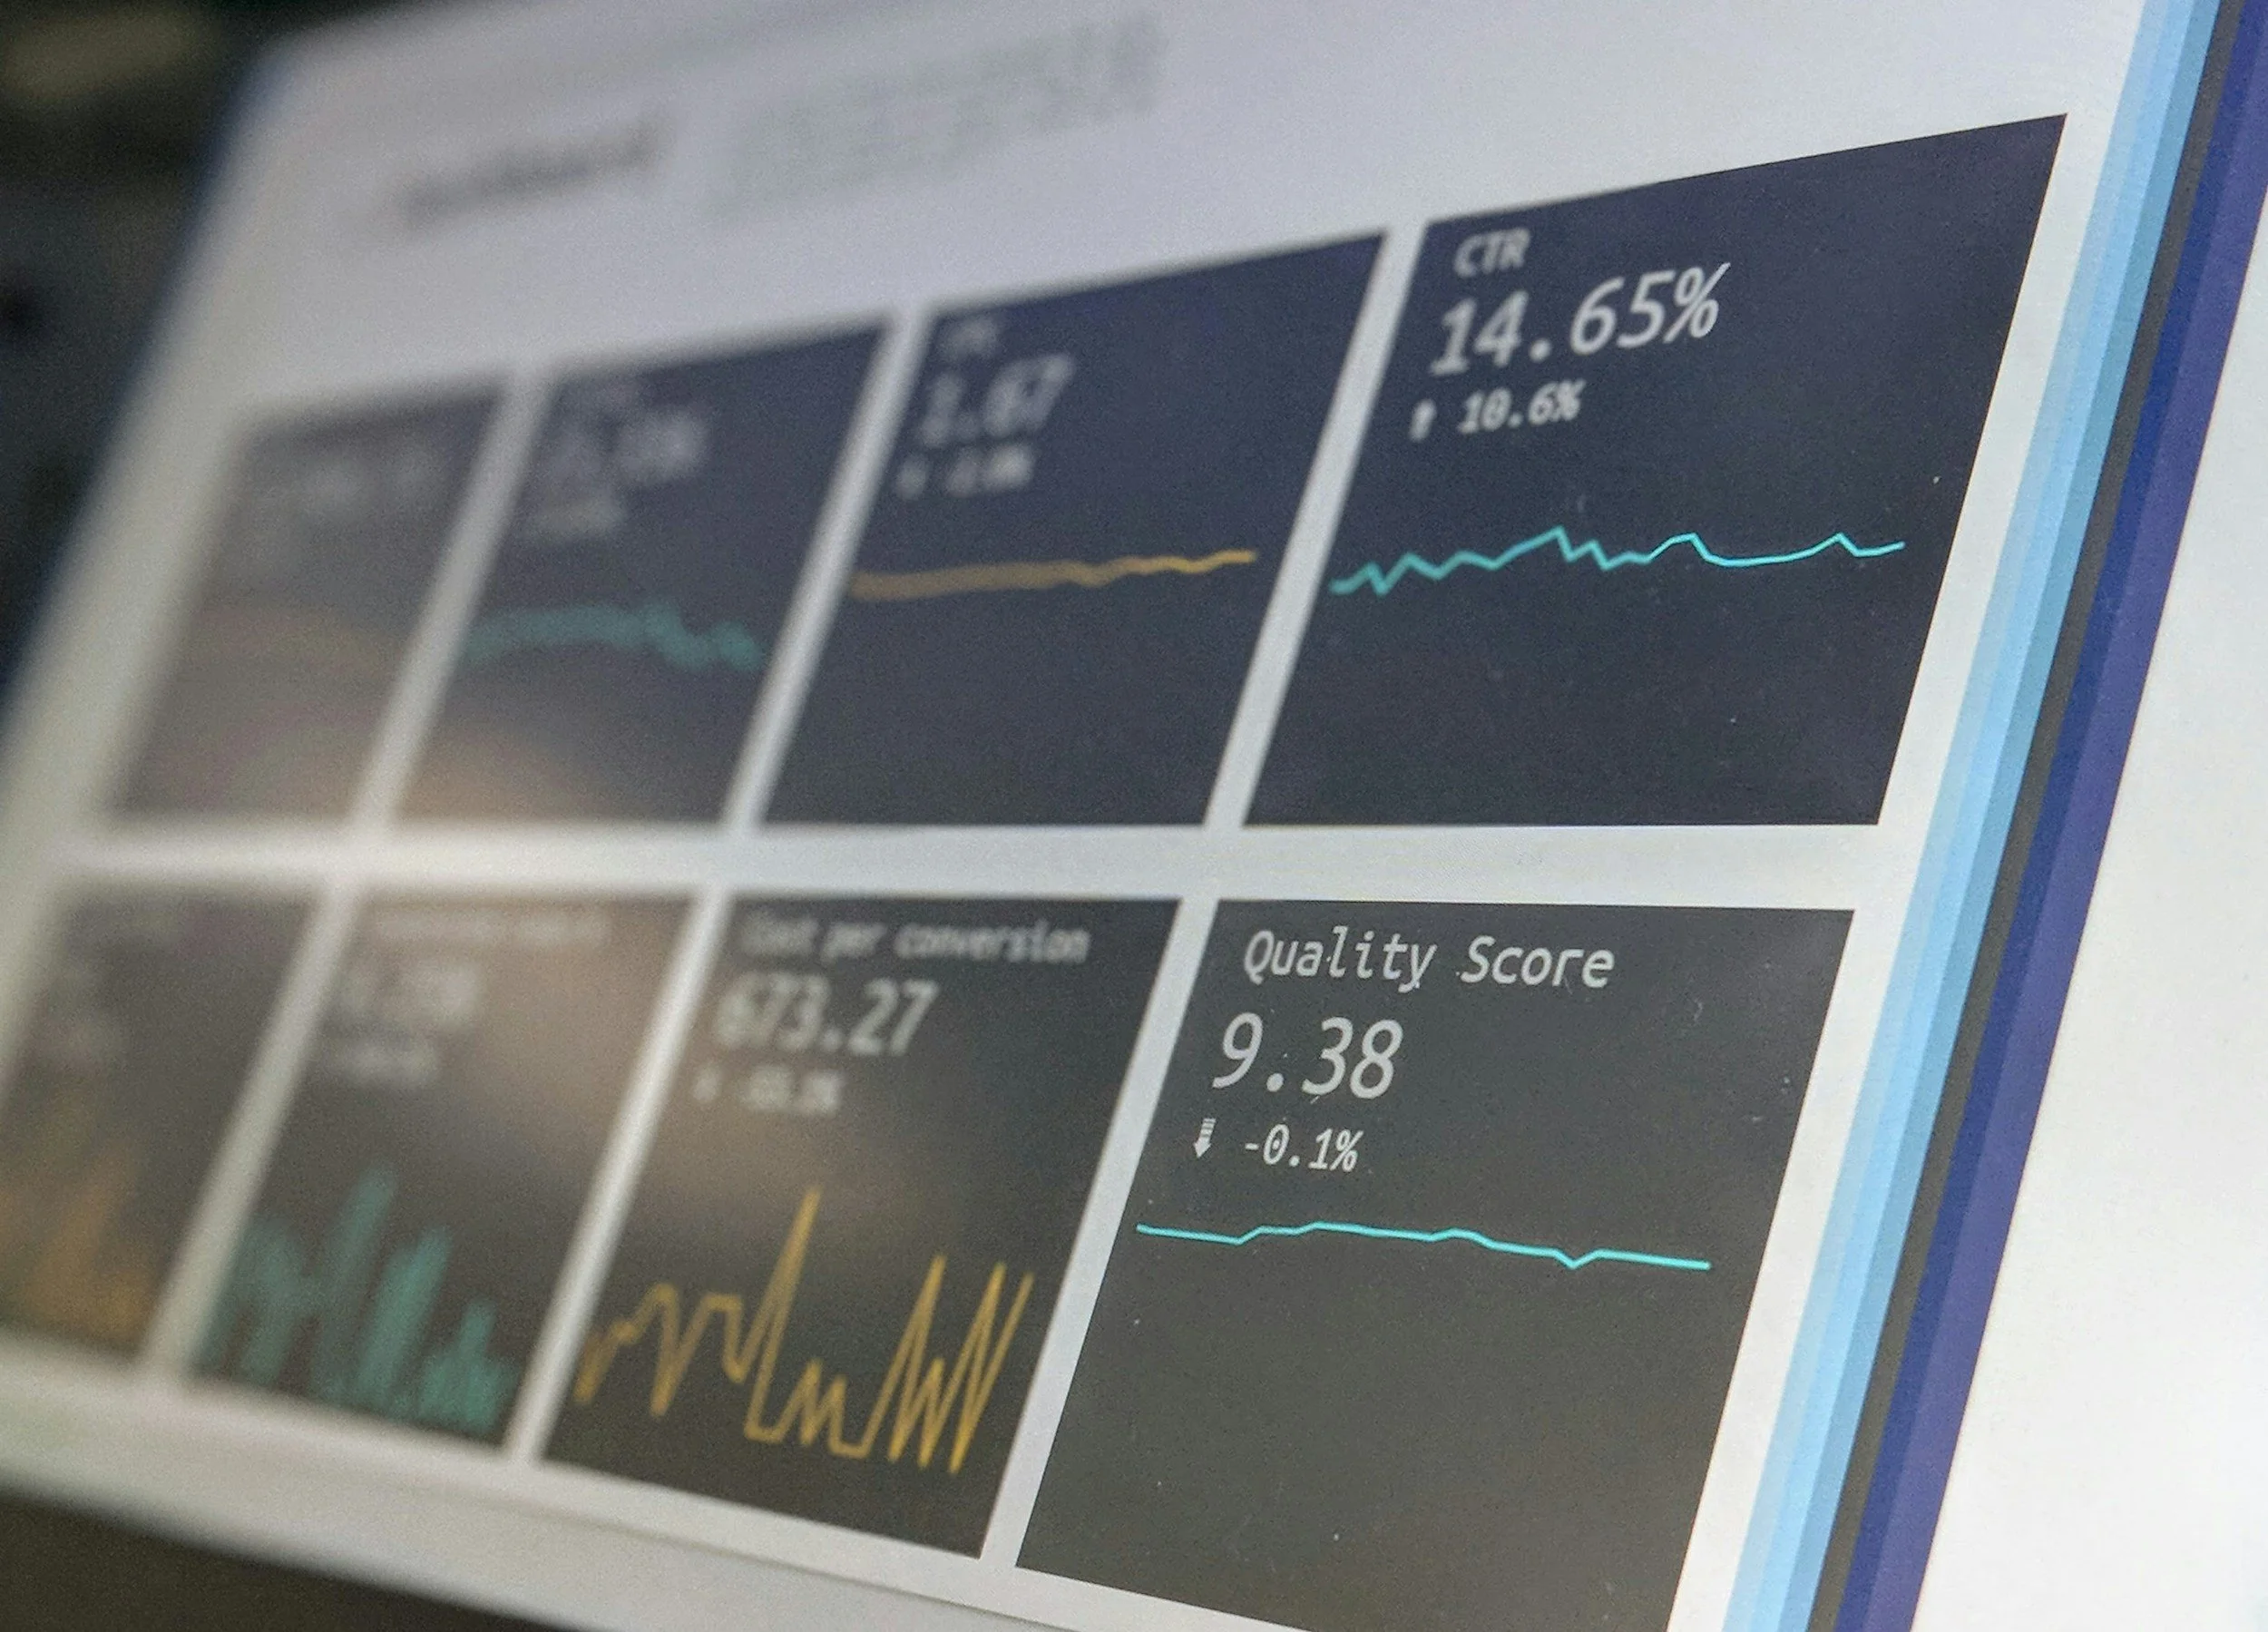
Business Intelligence (BI) tools like Looker, Power BI, and Tableau turn raw data into visual, actionable dashboards. With real-time metrics, clean visualization, and easy filtering, these platforms allow stakeholders to make informed, data-driven decisions quickly.

Common Use Cases
Creating executive dashboards for KPIs
Visualizing marketing, sales, or ops performance
Unifying multiple data sources (CRM, ads, product)
Automating weekly/monthly reporting
Supporting board or investor reporting needs

Who is this for?
PortCos lacking visibility into business performance
Founders and operators frustrated with spreadsheet chaos
Growth teams needing data to make decisions faster
Analysts seeking scalable reporting infrastructure
Why Claymore Connect
We match you with BI consultants and firms who can implement, customize, and maintain dashboards in tools like Looker, Power BI, and Tableau.

Platform implementation and data modeling

Visualization and stakeholder UX
Source integration and pipeline setup

Training and documentation

Sample Results
Full marketing + sales dashboard deployed in 3 weeks
$5M budget reallocated based on visibility from BI
10+ reports automated, saving 40+ hours/month
Board reporting simplified into one dashboard

What to Look for in a BI Partner
Platform-specific expertise (Looker, Power BI, Tableau)
Data modeling and SQL fluency
Integration with CRM, ad platforms, and ops systems
UX-first design for dashboards
Training and handoff included

Related Services
ETL & Data Warehousing
Revenue Forecasting
CRM Integration
Attribution Modeling
Analytics Strategy
Get Matched with a BI Partner
We’ll introduce you to a dashboard expert who’ll bring your data to life.